Entry Summer 2015
Important Trends in Homeowners Insurance Claims
By David Corum
Homeowners and personal auto insurance are the most significant property-casualty insurance products most households will ever purchase. According to the National Association of Insurance Commissioners, the average written premium countrywide for owner-occupied homeowners insurance coverage using the HO-3 form was $1,034 in 2012.[1] By comparison, the average household expenditure for personal auto insurance countrywide was $1,018.[2] For the first time ever, households in 2012 spent more, on average, for homeowners insurance than they did for personal auto coverage.
Of course, the above comparison doesn’t apply to every household. Many do not purchase HO-3 coverage, and only 37 percent of renting households purchase renters insurance.[3] Personal auto insurance purchases also vary across households, and as many as 12.6 percent of all drivers go without insurance coverage altogether.[4] Nevertheless, 2012 marked an important, and largely unnoticed, development as the cost of homeowners insurance exceeded, for many households, the cost of auto insurance.
Among the possible implications of this development will be increased regulatory scrutiny and public questioning of matters related to homeowners insurance. It is incumbent on the insurance community to be prepared to identify and explain the factors and forces behind rising homeowners insurance costs. To assist in this regard, the Insurance Research Council, a division of The Institutes, recently completed a detailed analysis of homeowners insurance claim trends over a 17-year period beginning in 1997.[5] Without a doubt, underlying claim trends are the single most important determinant of ultimate insurance costs for consumers.
Rapidly Rising Claim Severity
In its report, IRC documented an annualized average increase of 7.8 percent per year in the average payment for homeowners insurance claims countrywide.[6] The average claim payment (a.k.a. “average claim severity”) increased from $2,676 in 1997 to $8,787 in 2013. Over the same period, inflation averaged only 2.5 percent per year—less than one-third the rate of increase in average claim payments.
Figure 1 depicts the increase in average claim severity and inflation by indexing each series to 1. Also shown is the 1997-2013 trend in total claim payments averaged over all insured homes (a.k.a. “paid loss costs”). Average paid loss costs increased at an annualized rate of 5.0 percent per year—substantially less than the rate of increase in average claim severity but still twice the rate of inflation. The reason why average loss costs increased less rapidly than average paid claim severity is discussed below.
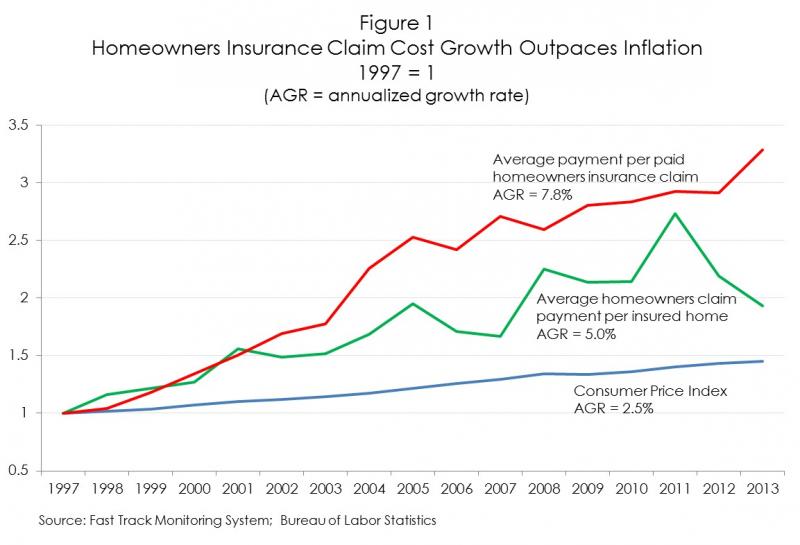
The growth in underlying claim costs depicted in Figure 1 is undoubtedly the chief explanation for why homeowners insurance coverage costs have come to exceed personal auto insurance costs for many households. Preliminary research by IRC has documented much smaller growth in auto liability claim costs.[7] The relevant question is why homeowners claim severity increased so rapidly. Several contributing factors may form the answer to this question:
- The growing size and complexity of homes. According to the U.S. Bureau of the Census, the median square footage of single-family houses constructed in 2013 was 21 percent greater than that of houses constructed in 1997.[8] With the growth in the size and complexity of homes, increases in insured values have helped push claim costs higher.
- Changing weather patterns producing more frequent severe storms. Climatologists have linked changes in global climate patterns to an expected increase in severe thunderstorm activity in the United States.[9]
- Dramatic increases in the price of oil-based building materials. Roofing costs represent a significant portion of total homeowners insurance claims costs. The producer price index for oil-based roofing and siding materials increased at a 7.1 percent annualized rate from 1997-2013. Most of the increase occurred in the mid-2000s as a result of changes in oil refining technology and shortages in asphalt flux—the primary material used in the production of asphalt shingles and other roofing materials. A number of refineries reduced production of asphalt flux, or ceased production altogether, resulting in shortages and higher prices in areas where demand increased as a result of severe storms and other weather events.[10]
- The widespread adoption of higher deductibles. Figure 1 indicates that average loss costs (average claim payment per insured home) for homeowners insurance coverage increased at a slower rate than average claim severity. A likely explanation for this difference may be a decrease in claim frequency due to widespread adoption of higher deductibles which resulted in fewer lower cost claims. As the number of lower cost claims fell, the average cost of the remaining claims increased. In addition, the elimination of claim payments associated with relatively minor claims helped reduce the overall cost of claims, thereby reducing costs averaged over all insured exposures. Both of these effects likely contributed to a greater rate of increase for claim severity than paid loss costs.
Declining But Highly Volatile Claim Frequency
Another reason why average claim payments per insured home (loss costs) rose more slowly than the average payment per claim (paid claim severity) is that homeowners claim frequency fell over most of the study period. The countrywide claim frequency rate (number of paid claims per 100 insured homes) fell, on average, 2.6 percent per year, from 8.6 in 1997 to 5.0 in 2013. The decline in claim frequency was limited, however, to noncatastrophe-related claims. When reporting their claims experience, insurers typically report all claim experience and then claim experience excluding catastrophe-related claims. The claim frequency rate for catastrophe-related claims actually increased from 1997-2013 at an annualized rate of 1.3 percent per year. However, the frequency rate for noncatastrophe-related claims decreased 4.6 percent per year, more than offsetting the increased frequency of catastrophe-related claims.
Volatility refers to the degree to which claim frequency rates change from one year to the next and the extent to which the frequency trend maintains a consistent direction (that is, increasing, decreasing, or remaining level). Homeowners insurance claim frequency trends are highly volatility. This is especially true for claims arising from catastrophes.
IRC calculated volatility index values to compare trend volatility in different states. Volatility index values range between 0 percent and 100 percent, where the value represents the percentage of year-to-year variation that is explained by a simple linear model of actual experience. A lower volatility index value means that relatively less of the year-to-year variation in claim frequency is explained by a simple linear model of the actual experience. Conversely, an index value approaching 100 percent means that most of the year-to-year variation is not explained by the linear model and that the trend is highly volatile.
The volatility index value for homeowners claim frequency countrywide was 45 percent, meaning that almost one-half of the year-to-year variation in claim frequency was not explained by a simple linear trend. Most of this volatility was due to the volatility of catastrophe-related claim frequency, indicated by a volatility index value of 95 percent. In contrast, the trend in noncatastrophe-related claim frequency was only 25 percent.
A similar analysis of homeowners claim severity revealed much less volatility for all claims and separately for both catastrophe-related and noncatastrophe-related claims.
Different States – Different Trends
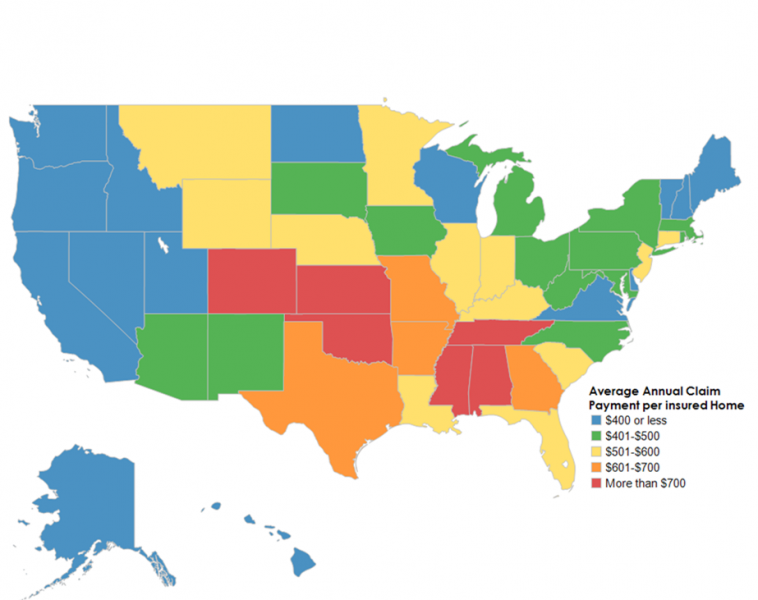
It would be reasonable to expect to find different homeowners insurance claim outcomes and trends in different states. After all, home values and construction costs vary widely, as do the risks of particular perils like wildfire, hurricane, and tornadoes. Figure 2 illustrates just how much individual state trends and outcomes can differ. The figure depicts the average annual claim payment per insured home (loss costs) in each state for the five-year period, 2009-2013. Six states (Alabama, Colorado, Kansas, Mississippi, Oklahoma, and Tennessee) experienced five-year average annual paid loss costs greater than $700. Four additional states (Arkansas, George, Missouri, and Texas) experienced five-year annual averages between $601 and $700. At the other end of the spectrum, 15 states experienced average annual paid loss costs of $400 or less. As is readily apparent, the higher cost states were concentrated in the South-Central U.S., and lower cost states tended to be on or near either the East or West Coast.
The IRC has produced two-page research briefs summarizing basic homeowners claim trends for selected individual states. The state briefs are available for download, free of charge, from the IRC website (www.insurance-research.org).
It is important to note that average homeowners claim costs, both loss costs and average paid severity, can change dramatically from one year to the next. A state experiencing a year of low average costs could experience higher than average costs the next year due to a more active storm season. Averaging costs over a five-year period allows for a more realistic comparison of costs in different states. Even then, however, costs differences across states can be dramatically affected by a single year’s experience. In Florida, for example, paid loss costs average $512 for the period 2009-2013. If 2004’s experience in Florida had been repeated during that time period, Florida’s average loss costs, even without adjusting for inflation, would have exceeded $800.
The average state costs depicted in Figure 2 should not be viewed as a representation of prospective risk. Using Florida again as an example, the prospective risk faced by homeowners and insurance companies is very high, compared to most other states, due to its exposure to potentially catastrophic hurricanes and the high value of property located in exposed coastal areas. Figure 2, therefore, may be useful in understanding recent claim experience, but it is not intended to be interpreted or used as a measure of future expected costs or trends.
Conclusions and Response
From the IRC’s analysis of basic homeowners claim trends, three key facts emerge to challenge the insurance community in the years ahead:
Rapidly rising claim costs. On a countrywide basis, homeowners insurance claim costs have been rising at a rate that is 2 or 3 times greater than the rate of inflation, depending on the measure used. In some individual states, claim costs have been rising even more rapidly. The continuation of this trend is, at best, problematic, given the likelihood that rising coverage costs will attract increased attention and reaction from regulators and the public. Managing growth in claim costs will be a significant challenge for the homeowners insurance community in the years ahead, should the trends documented by IRC continue.
Extreme volatility. That homeowners insurance claims experience is more volatile, especially at the state level, than claims experience in most other property-casualty products is not news. Extended periods of relative calm in some states, such as Florida, will tempt many to disregard or discount the importance of accurately acknowledging and fully confronting the potential risk of future catastrophe events. Emphasizing future risk potential and distinguishing between recent past experience and future risk will be another major challenge for the industry.
Emerging “hot zones”. The IRC analysis of homeowners claim trends in individual states revealed several states (including, in particular, Colorado, Oklahoma, and Kansas) where claim costs appear to have shifted to new and significantly higher levels, and have stayed at the new levels. In Colorado, for example, paid loss costs averaged $804 for the 5-year period 2009-2013, which was 179 percent more than the average payment per insured home ($288) during the previous 12 years. A full understanding of the factors and conditions causing this apparent shift is needed.
The property-casualty insurance industry has responded to the challenges posed by today’s homeowners insurance environment in several ways. Homeowners insurance products have been redesigned to better serve insurance markets. For example, the widespread availability of special endorsements allows insurers to modify or expand coverage provided in a single policy, and higher deductible options provide a tool by which consumers can manage their insurance costs while preserving critical protection. Insurers also have incorporated sophisticated models into their business processes to more effectively evaluate and manage catastrophe risk, and have adopted more refined rating plans that more closely match individual policy risks and premiums. Another response by some insurers has been to offer mitigation discounts to policyholders who take specific steps to reduce the risk of loss, such as installing roof straps and hurricane shutters in wind-prone areas.
Another response to the changing claim environment has been increased efforts to combat claim fraud. Catastrophic weather events that displace hundreds of families and produce numerous simultaneous insurance claims often result in fraudulent activity and behavior. The National Insurance Crime Bureau,[11] the Coalition Against Insurance Fraud,[12] and several state-based organizations have increased efforts and strengthened programs to educate consumers about insurance fraud and to identify and prosecute its perpetrators. In addition, many individual carriers support internal investigative efforts and work closely with local law enforcement officials to fight claim fraud.
The industry has also invested in advancing the science and engineering of loss prevention and mitigation. In addition to the efforts of individual insurers, the industry has coordinated loss prevention and mitigation research efforts through the work of the Institute for Business and Home Safety (IBHS). IBHS conducts research on home and building construction design standards and methods aimed at strengthening homes, businesses, and communities against the destructive effects of natural disasters and other causes of loss. IBHS promotes the use of building materials, design standards, and construction techniques aimed at minimizing loss to life and property from natural disasters and other perils. IBHS is also an active advocate for strong state and local building codes.[13]
Increased regulatory scrutiny and public questioning of matters related to homeowners insurance will almost surely follow from the trends and developments reviewed here. Being prepared to explain and discuss these trends and developments, and how the insurance community is responding, will pose significant challenges and opportunities in the years ahead.
[1] National Association of Insurance Commissioners, “Dwelling Fire, Homeowners Owner-Occupied, and Homeowners Tenant and Condominium/Cooperating Unity Owners Insurance: Data for 2012,” January 2015, p. 33.
[2] U.S. Bureau of Labor Statistics, www.bls.gov/cex/2012/standard/multiyr.pdf (accessed March 26, 2015).
[3] Insurance Information Institute, “The Insurance Fact Book 2015,” p. 103.
[4] Insurance Research Council, “Uninsured Motorists, 2014 Edition,” August 2014, p. 4.
[5] Insurance Research Council, “Trends in Homeowners Insurance Claims, 2015 Edition,” February 2015.
[6] The IRC findings reported here and elsewhere in this paper are for all policy forms combined.
[7] Insurance Research Council, Trends in Auto Injury Claims, 2015 Edition, forthcoming.
[8] U.S. Bureau of the Census, www.census.gov/construction/chars/pdf/medavgsqft.pdf (accessed December 16, 2014).
[9] Noah S. Diffenbaugh, Martin Scherer, and Robert J. Trapp, “Robust increases in severe thunderstorm environments in response to greenhouse forcing,” Proceedings of the National Academy of Sciences, October 8, 2013, www.pnas.org/content/110/41/16361.full.pdf+html, (accessed March 26, 2015).
[10] Midwest Roofing Contractors Association, “Dramatic Changes Seen in Asphalt Roofing,” Midwest Roofer, February 2013, mrca.org/uploads/files/members/residential/ ResRoofAsphaltShinglesMRFeb2013.pdf (accessed December 16, 2014).
[11] More information about the National Insurance Crime Bureau can be found at www.nicb.org.
[12] More information about the Coalition Against Insurance Fraud can be found at www.insurancefraud.org.
[13] More information about the Insurance Institute for Business and Home Safety can be found at www.disastersafety.org.
Entry - May 13th, 2015
Could a Nevada Bill Aiming to Reduce Uninsured Motorists Actually Work?
By Patrick Schmid
Motorists who forgo purchasing auto insurance create problems for regulators, insurers, and insured drivers. In addition to paying for insurance that covers their own actions, insured drivers pay a portion of the costs generated by drivers who are uninsured. They do so by purchasing uninsured motorists (UM) coverage.
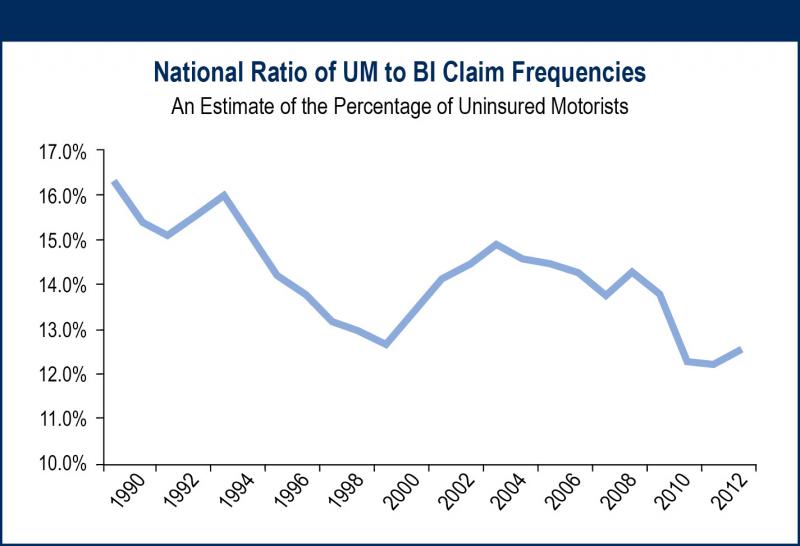
The Insurance Research Council (IRC) analyzes auto injury claim frequency data to estimate the percentage of drivers who are uninsured. The IRC’s most recent UM study, based on 2012 claim frequency data, shows that even though the percentage of UMs trended down over the past few years, about one in eight drivers remain uninsured. This translates to about 30 million drivers countrywide.
Many states have enacted laws and penalties targeting UMs. The Nevada legislature is currently considering a bill that would limit lawsuit payouts to uninsured drivers involved in auto accidents. These no pay, no play laws, which are in the books in varied forms in 10 states, prevent a UM from collecting compensation for noneconomic damages arising from a traffic accident with an insured, at-fault driver. Noneconomic damages include compensation for pain and suffering, emotional distress, inconvenience, and so forth. It should be noted that these laws still allow the uninsured driver to collect economic damages (which may include repair costs, medical bills, lost wages, future economic loss, etc.).
Critics claim these laws disproportionally affect the least fortunate. Proponents of the law say it would help insurance consumers in two ways. First, the law may reduce insurance costs by lowering the amount paid in noneconomic damages to the uninsured. Second, these laws may incentivize uninsured drivers to become insured.
A recent IRC study, The Potential Effects of No Pay, No Play Laws, provides insight into the potential effects of enacting the proposed legislation in Nevada. The study estimates that Nevada paid $16.5 million in noneconomic damages to UMs in 2014. Under a fully effective no pay, no play law, these costs would be eliminated, which could result in premium savings for Nevada’s insured motorists.
The IRC study also analyzed historical claim data to determine whether the percentage of UMs within a state was affected by the adoption of no pay, no play laws. The IRC found that UM rates fell 1.6%, on average, after states adopted no pay, no play laws.
A decline of this magnitude could potentially decrease Nevada’s UM rate (which currently stands at 12.2%), the number of uninsured (estimated to be 232,182) and the state’s UM claim payments (which total $46.5 million).